Last month in October EFY2016 (Ethiopian fiscal year), the price of vegetables experienced the most significant increase on a month-to-month basis; showed a substantial jump of 4.9 percent, said Central Statistical Service of Ethiopia.
“Followed by increases in the prices of Bread and Cereals 4.1 Percent, Sugar Jam, Honey and Chocolate 1.3 percent, Milk, cheese, and eggs , with a rise of 1.0 percent. Similarly, the prices of Fruit saw a significant increase of 2.6 percent, while the cost of Meat rose by 0.9 percent. These notable price movements underscore the impact on consumers and highlight the challenges faced in the food sector during the month,” the Central Statistical Service (CSS) said in its report released today.
On the other hand, looking at non-food items, the biggest increase in month-to-month comparison was observed in Education (6.7), followed by Housing, Water, Electricity, Gas and Other Fuels (2.3%) and Restaurants and Hotels (0.9 %), according to the CSS report.
“Moreover, increase in growth rate of price for Alcoholic Beverages and Tobacco, which is among the highest weight in the non-food basket, contributed to increase of month-to-month non-food items. Alcoholic Beverages and Tobacco price increased by 1.7 percent between September EFY2016 and October EFY2016. Further, Increase were observed in Clothing and Footwear (1.0) and Miscellaneous,” it said.
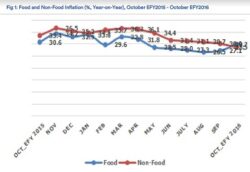
CSS’s report also stated that The CPI of Food and Non-Alcoholic Beverages has, on average, increased by 29.7% last October compared to October 2015 Ethiopian fiscal year. The year-on-year inflation rate of the Food and Non-alcoholic component of the CPI, for the month of October 2016 Ethiopian fiscal year, stood at 29.7%.
“The major contributing factors for the rise of food inflation for October EFY2016 was the observed increase in the average prices of major food commodities such as bread and cereals (44.6%), vegetables (41.9%), meat (28.8%), Sugar, jam, honey and chocolate Accordingly, the country’s year-on-year general inflation rate, representing the annual percentage change, recorded an increase from 28.3 percent in September EFY2016 to 29.2 percent in October EFY2016,” it said.
Comparatively, the inflation rate for the same month in the previous year, October EFY2015, was 30.7 percent. Notably, for the last six months, since March EFY2015, the inflation rate showed reduction. Reduced from 34.2 percent in March EFY2015 to 33.5 Percent in April, 30.8 percent in May, 29.3 percent in June, 28.8 percent in July, 28.2 percent in August, 28.3 Percent in September EFY2016.
“…Both the food and the non-food year-on-year inflation have continued to be stubbornly high. Similarly, a more pronounced price increment in the major Non-food components of the CPI was observed. The Non-Food inflation increased by 28.5 percent in the same period. Particularly, Alcoholic Beverages and Tobacco (26.9%); Housing, water, electricity & other fuel component (36.5%); Furnishings, household equipment & routine maintenance of the House (26.4%); Clothing and footwear (21.5%); Health (42.6 %); Education (21.4 %); Communication (28.8), Restaurants and hotels (29.6%) and Misllanoues goods and services (24.3 %) have contributed for the rise in non-food inflation rate in October EFY2016,” CSA said.
“When we look at the dis-aggregated year-on-year inflation rate of Food and Non-Alcoholic Beverages: Bread & Cereals (44.6%); Meat (28.8%); Milk, cheese & eggs (26.4%); Oils & fats (1.6%); Fruit (21.7%); Vegetables (41.9%); Sugar, jam, honey, chocolate (38.8%) and Food products not elsewhere classified (8.7%). Non-Alcoholic Beverages & coffee declined by (1.5%). Similarly, during October 2016 EFY the year-on-year inflation rate of the Non- Food Index of the CPI was 28.5%. In particular, Alcoholic Beverages & Tobacco (26.9%); Housing, Water, Electricity, Gas, & Other Fuels (36.5%); Furnishings, Household Equipment & Routine Household Maintenance of the House (26.4%); clothing and footwear (21.5%); Health (42.6 %) and Restaurants and Hotels (29.6%) have contributed for the rise in non-food inflation rate in October EFY2016,” it said.