Home prices in the U.S. rose again in April, albeit at a slightly lower rate than recorded in the prior month.
Home prices nationally rose from the end of March 2021 to the end of April 2021 at an annualized rate of 10.4 percent. This is indicated on Friday by Radian Home Price Index (HPI) data released today by Red Bell Real Estate, LLC, a Radian Group Inc. company (NYSE: RDN).
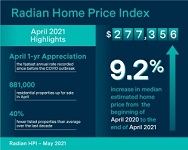
For the prior twelve months, the Radian HPI rose 9.2 percent (April 2020 to April 2021), the fastest annual rate recorded since before the COVID outbreak.
While the April month-over-month rate was slightly lower than the prior month, the twelve-month rate increased compared to March. Recent annual increases are benefiting from the more distanced months of lower appreciation recorded during the early days of the national shut-down.
The Radian HPI is calculated based on the estimated values of more than 70 million unique addresses each month, covering all single-family property types and geographies.
“As we are now a full year from the initial COVID induced national closures of 2020, the U.S.’s strong national housing market continues to chug along in April,” noted Steve Gaenzler, SVP of Data and Analytics.
“Pent-up demand for homes, improving economic activity, a strong labor market and low mortgage rates have been strong tailwinds for housing. However, as the U.S. starts to see growing considerations for ending or reducing government stimulus (monetary and fiscal) in the coming months, and concerns of higher potential inflation making headlines, there is a need to keep a very close eye on housing in the coming half year,” added Gaenzler.
NATIONAL DATA AND TRENDS
• Median home price in the U.S. rose to $277,356
• Active supply of homes well below long term average
The national median estimated price for single-family and condominium homes rose to $277,356. Since the start of the COVID lockdowns in March 2020, the average home in the U.S. has appreciated by more than $20,000. Home price appreciation over the past year has increased homeowner equity levels by more than $1.5 trillion dollars.
Gains in home prices are partially due to a continued lack of supply. After falling for 10 of the prior 12 months, active listings have now increased three consecutive months—although only by 32,000 properties from the prior month.
In April, more than 881,000 residential properties were for sale, the fifth month with less than one million properties listed nationally.
Over the last decade, the U.S. has had an average of 1.4 million homes on the market each month. At the current count of active listings, the U.S. has 40 percent fewer homes on the market, on average, than at any time over the past decade.
REGIONAL DATA AND TRENDS
• All Regions reported solid appreciation from prior month.
• Three Western states consistently demonstrate strong home price appreciation
While all six Regional indices reported higher 12-month rates of home price appreciation, only two Regions (Mid Atlantic and Northeast) reported higher rates of appreciation compared to March.
In April, the Northeast narrowly edged out the South Region for the highest appreciation rate (+11.9 percent). All Regions showed strength in the month with the worst performing Region (Midwest) still recording a very impressive 9.1% increase from the prior month.
Looking at trends from the last six months, the Radian HPI can identify some state-level winners and losers. The states showing the greatest increase in appreciation trends include a combination of South, Southwest and Midwest states including NE, AZ, AR, and MS. The most consistently strong states for appreciation in the last half year include ID, MT, GA, and WA.
While these states showed increasing or consistently steady rates of appreciation, eleven of the 50 states plus DC, recorded lower monthly appreciation rates than the average appreciation over the last six-months including NC, ND, WV and KY.
METROPOLITAN AREA DATA AND TRENDS
• Boise got stronger in April
• Large metro areas median price outpace nation
Across the largest or most important metro areas of the U.S., the last three-months have been some of the faster appreciating on record with an average annualized rate of 9.6 percent appreciation.
The strongest metro markets over the last quarter include Boise, ID, which continues to rise rapidly, Phoenix, AZ and Charlotte, NC. Some of the slower appreciating larger cities and metro areas over the last quarter include Boston, MA, Fargo, ND, and Burlington, VT.
The average median estimated home price of homes in the 50-largest metros ended April at $295,259. However, just the top 20-largest metros topped an average median home price of more than $385,000.
Compared to the national median estimated price, the largest cities continue to outpace the nation. In April, the largest metros median stood more than $100,000 higher than the national median.
Red Bell Real Estate LLC, a subsidiary of Radian Group Inc., provides national and regional indices for download at radian.com/hpi, along with information on how to access the full library of indices.

